Measure It. Manage It.
How Dashboarding Turns Around Manufacturing & Logistics
Published July 22, 2026 · By RASGR
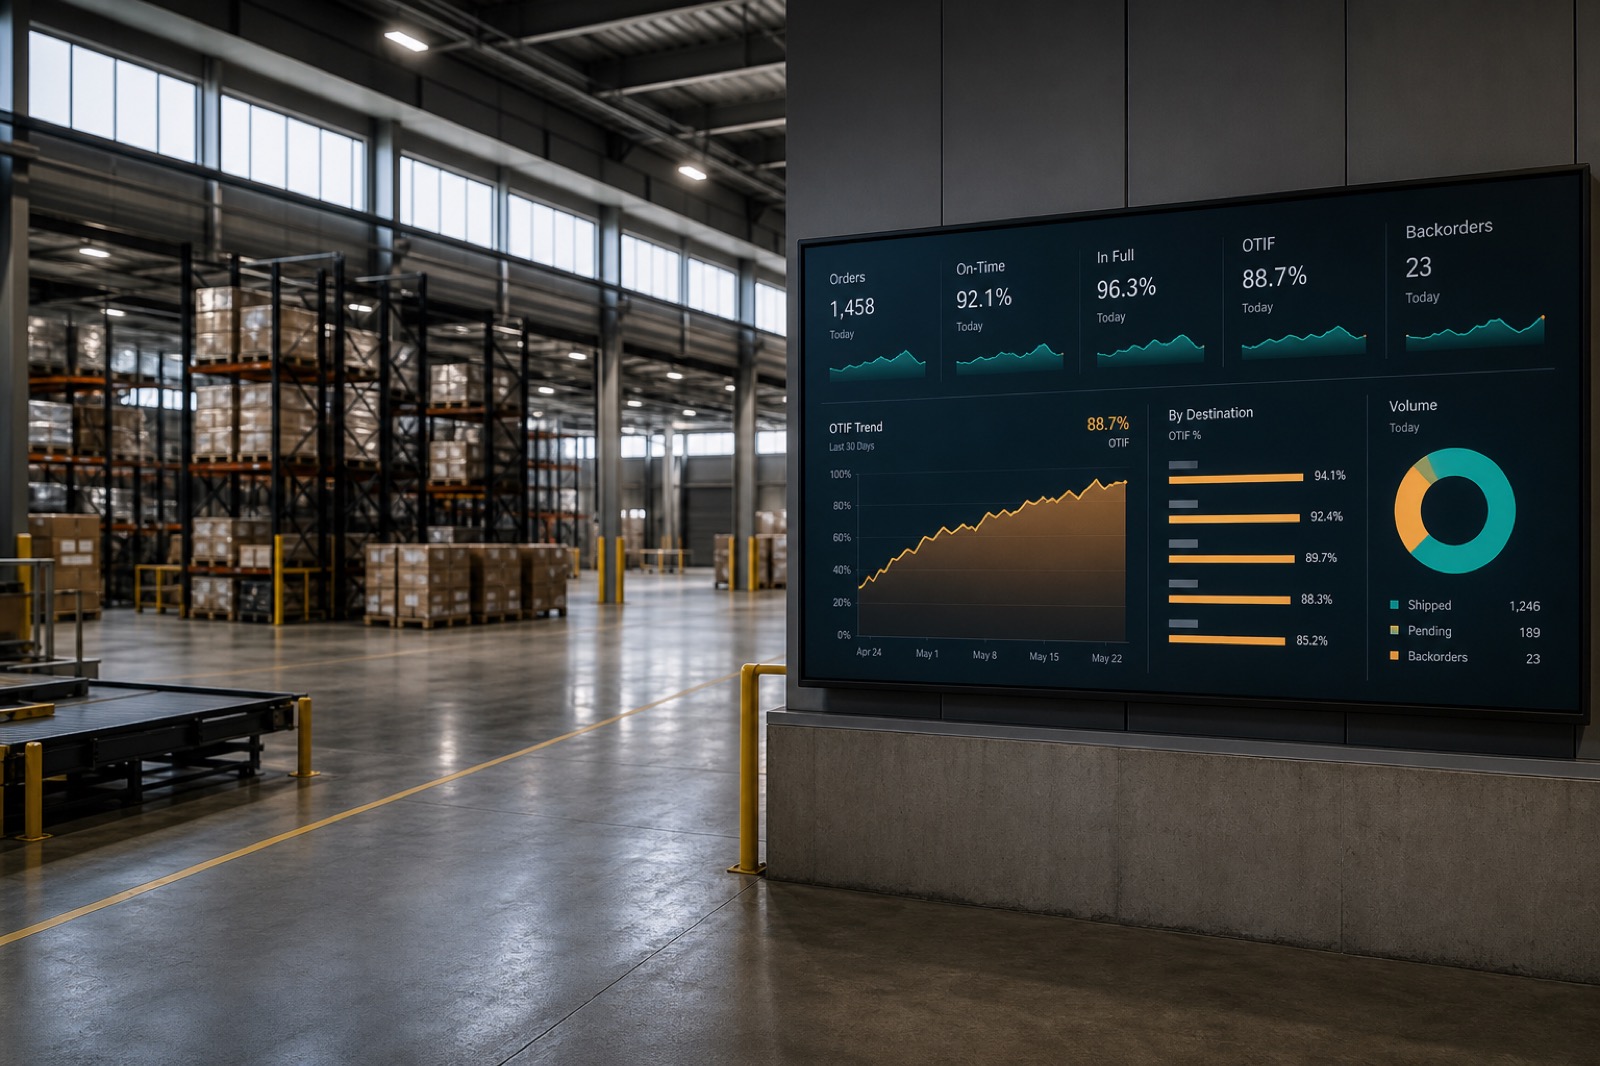
If you cannot see the truth of your operation — from the summary number down to the single failed transaction — you cannot turn it around. One lesson from decades inside manufacturing, logistics and warehousing across Asia has never failed: measure it, manage it.
At a company with roughly $13 billion in turnover, service was stuck. On-Time In-Full (OTIF) sat below 80%. Complaints were high. Costs were under pressure. Good people were burning out fighting fires they could not see coming. Within twelve months, using a fully data-driven dashboard approach, OTIF lifted to 98%+ — and held. Some business units went further still, reaching 99%.
The OTIF turnaround
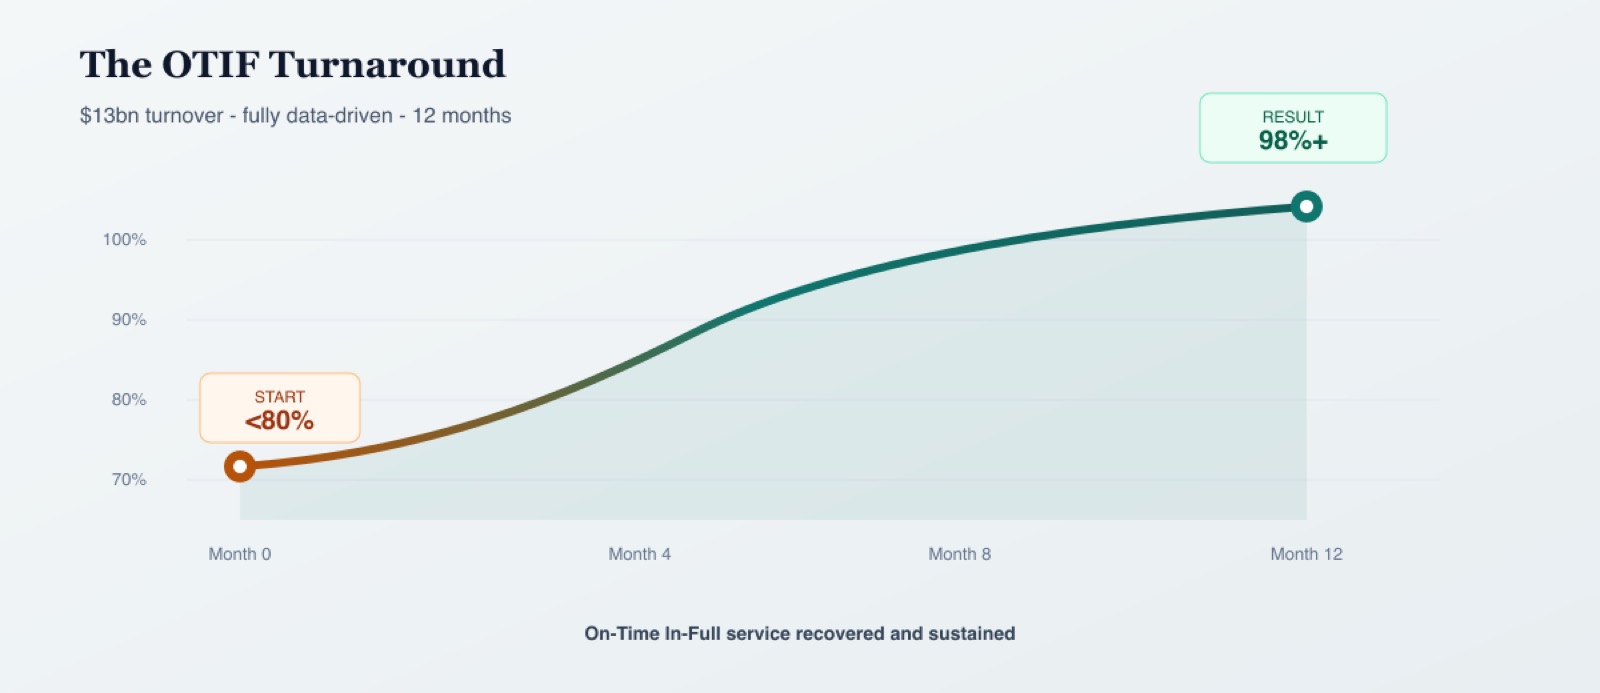
Figure 1 — The service recovery curve that changed how the business operated.
Why turnarounds stall
Most struggling operations do not fail because people do not care. They fail because the organisation cannot agree on what is true.
- One site reports OTIF one way; another site reports it differently.
- Leaders see a red KPI but cannot drill to the order, line, or exception that caused it.
- Problems are discovered after the customer already feels them.
- Improvement projects chase symptoms, not bottlenecks.
When that happens, meetings multiply, blame circulates, and the best people leave — because the job has become impossible to do well.
The architecture that works: summary → drill-down → transaction
In manufacturing and warehousing, the dashboard must do three jobs at once:
- Executive summary — OTIF, cost, complaints, throughput, and the few leading indicators that predict tomorrow’s failures.
- Operational process view — site, shift, lane, SKU family, machine or dock — wherever the bottleneck lives.
- Transactional drill-down — the order, pick, put-away, ASN, invoice, or exception. Who, what, when, and what to do next.
Transparency without drill-down is theatre. Drill-down without ownership is noise. Put both together and the organisation starts to manage reality instead of debating it.
And it does not matter which ERP you run. We have built this operating model on Priority, IBM iSeries, SAP, and Odoo — and we can work with any ERP. The principle is the same: one source of truth, transparent dashboards, and a path from the summary KPI to the transactional exception.
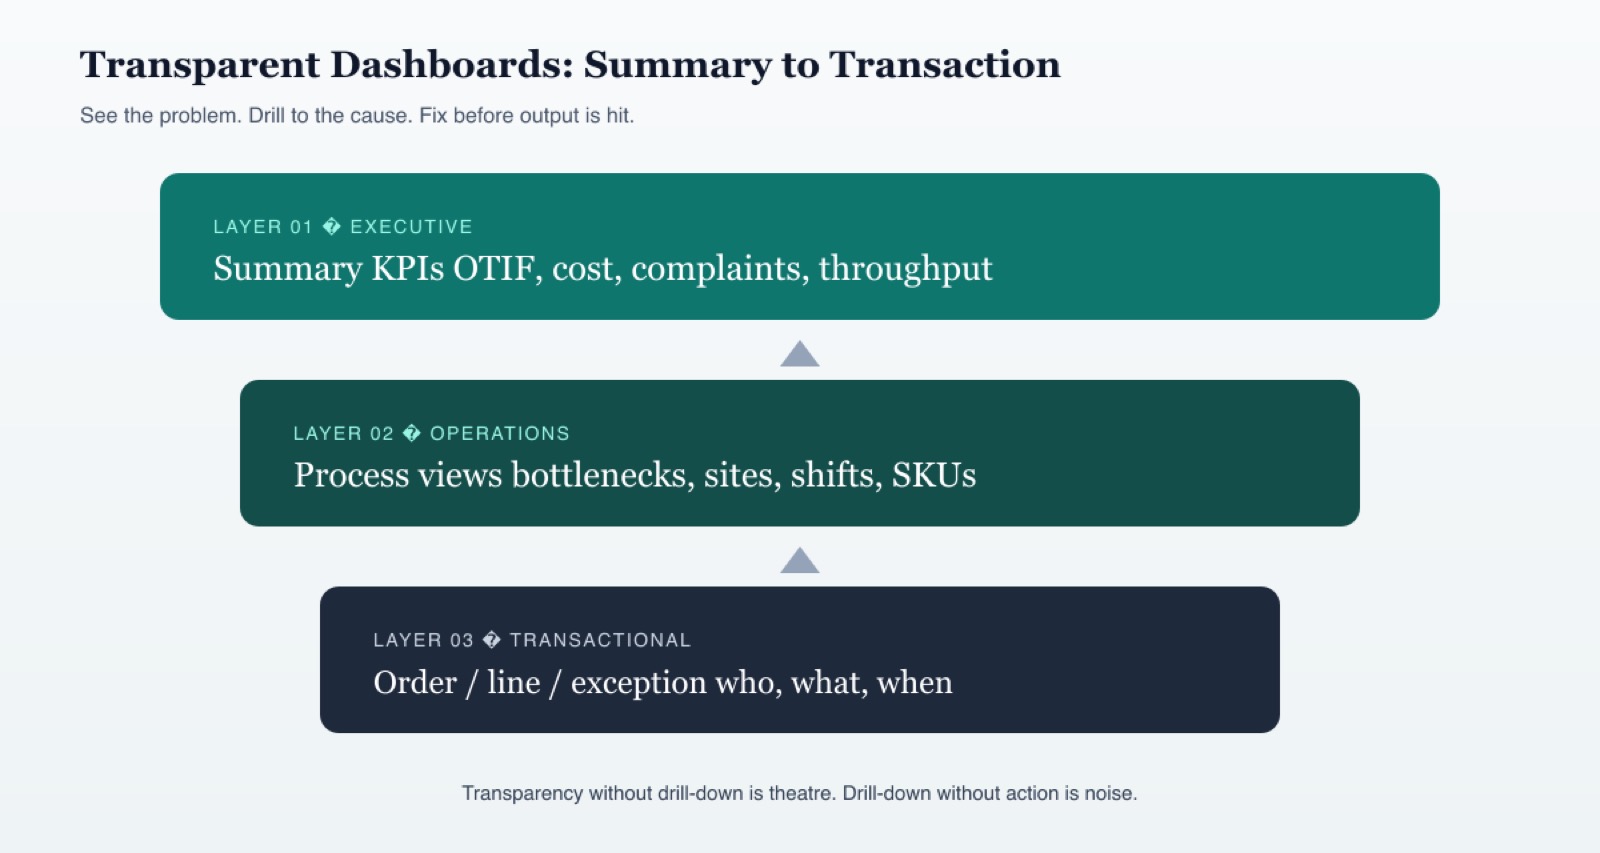
Figure 2 — Transparent layers: from the boardroom number to the warehouse transaction.
Visibility at every level — including the wall
Dashboards only change behaviour when people can see them without hunting for a report. We put large TV screens in the core areas of the operation — from the lobby, where performance was visible to visitors, through to the operational floors.
At any moment, anyone walking the building could see bottlenecks forming and act. Teams could tell when orders were approaching cut-off and move them along in time to meet trucks leaving. Supervisors did not wait for an end-of-day spreadsheet. Operators did not wait to be told. Leadership did not wait for a weekly pack.
That is visibility at all levels: the same truth on the wall for guests, managers, and the people doing the work — live enough to protect today’s departures, not just explain yesterday’s misses.
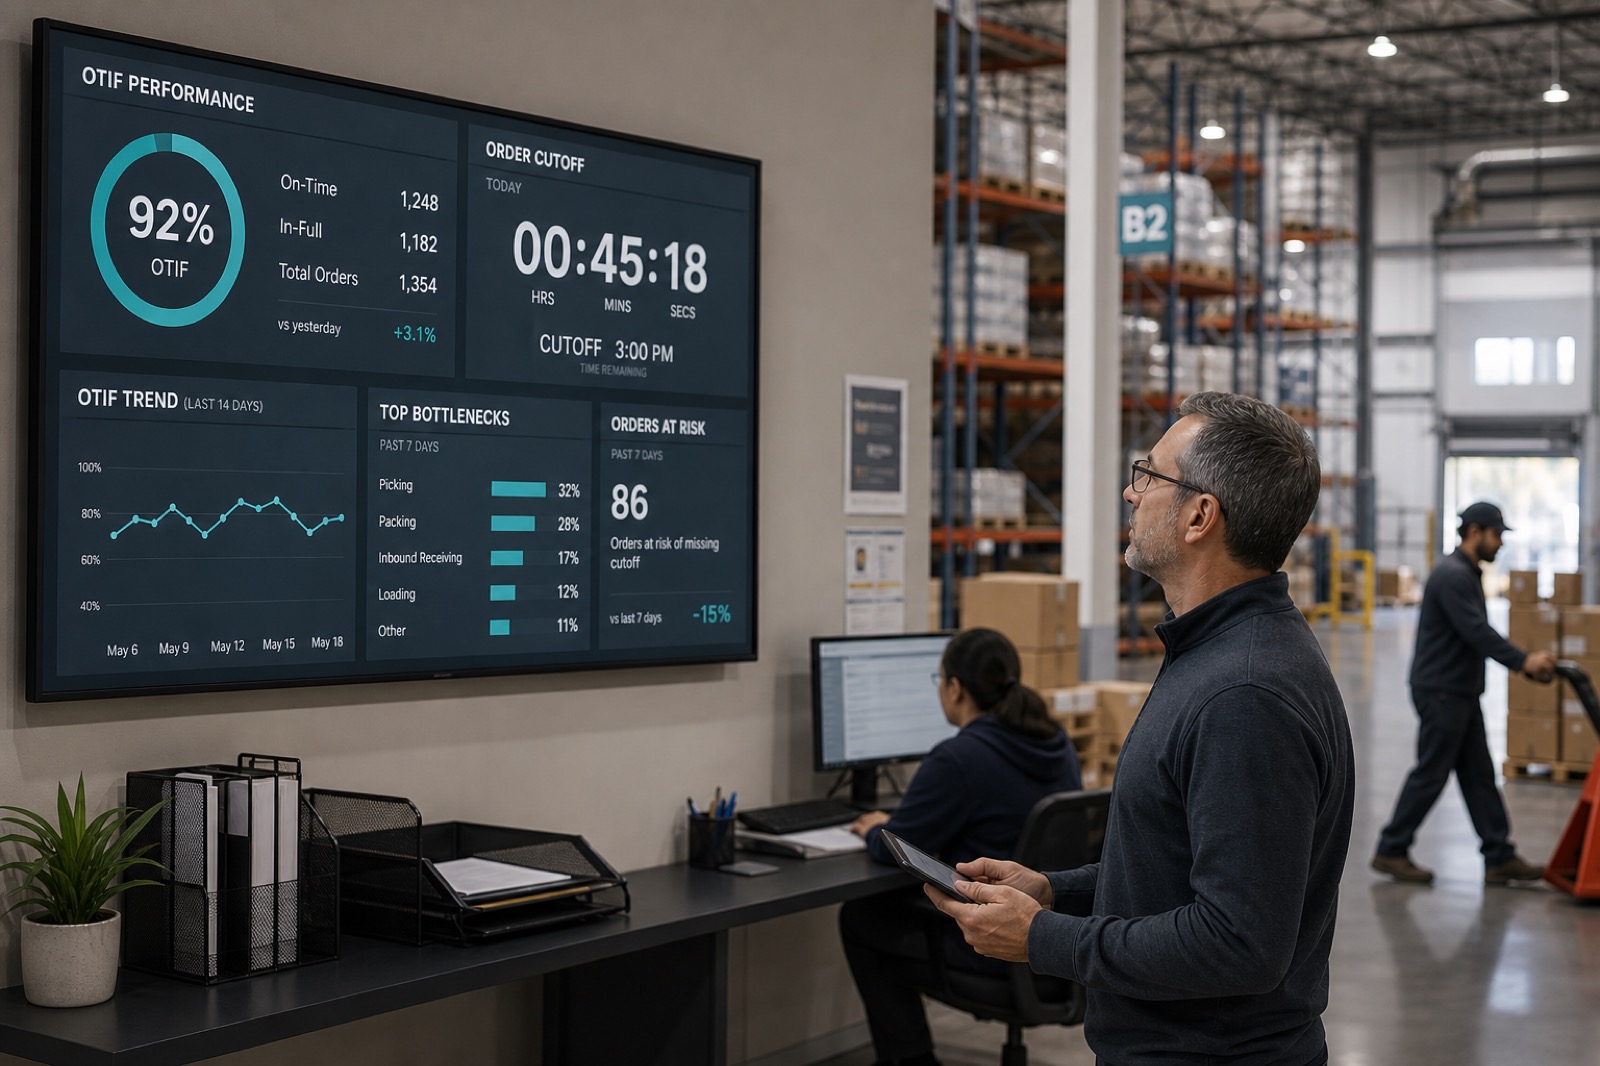
Figure 2b — Performance on the wall: lobby to shop floor, so action happens before cut-off.
What changed when we ran the business this way
1. Issues were caught before they hit output
Exceptions stopped being end-of-day surprises. Teams could intervene while there was still time to recover a shipment, a production slot, or a customer promise.
2. Bottlenecks became obvious — and removable
Instead of adding headcount or overtime as the default answer, the data found the real constraint. Addressing those bottlenecks lifted throughput considerably for the same cost base.
3. Customers calmed down — and so did the people
Complaints fell. Client and customer satisfaction rose. With fewer fires, teams finally had time for the interesting improvements that actually change a business. Staff retention improved because people could do their jobs properly and still have a quality of life.
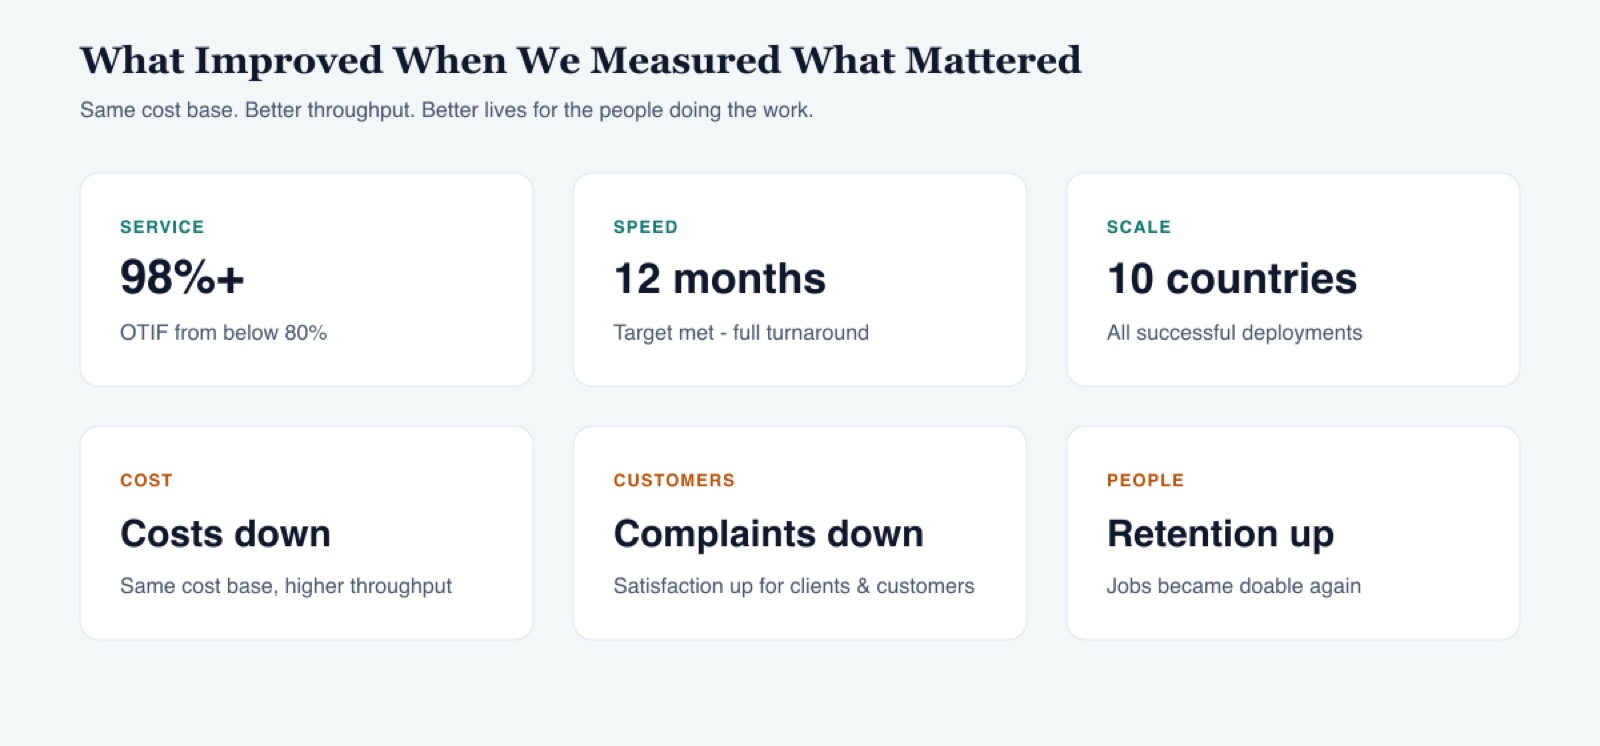
Figure 3 — The compound payoff of measuring what matters.
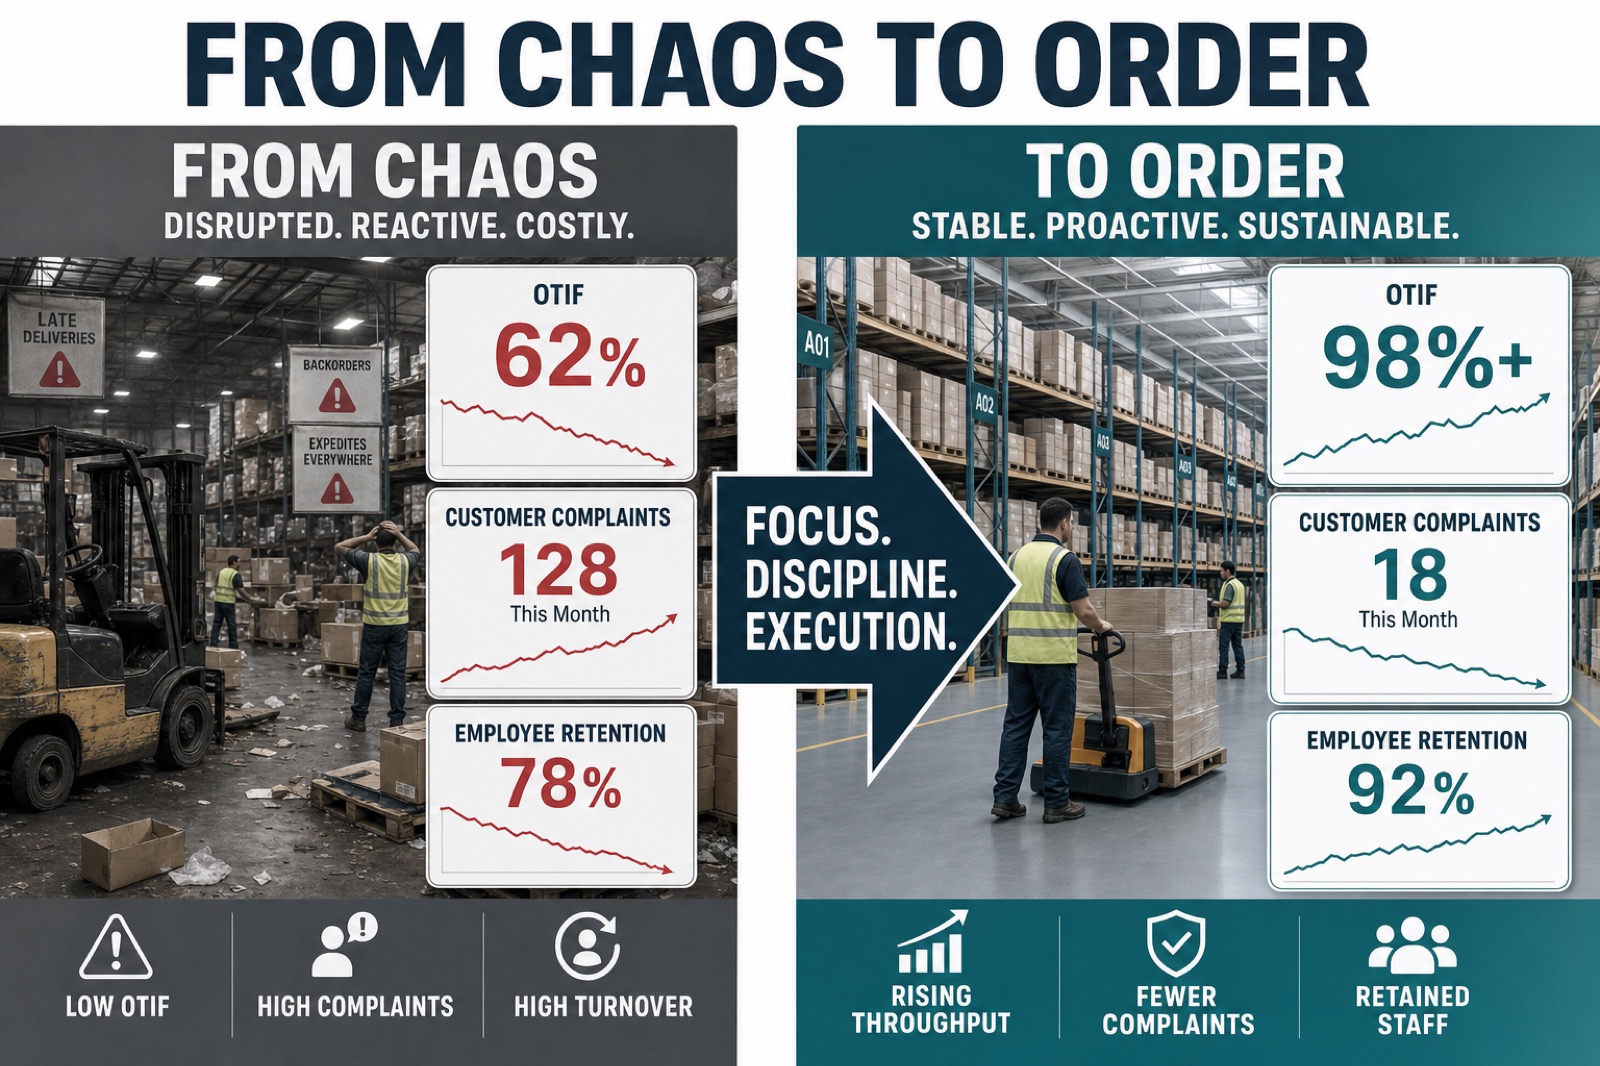
Figure 4 — Same business. Different operating system.
From the brink to best-in-company
The same process did not only lift the average. It rescued business units that were genuinely struggling — operations that looked, from the outside, like they might not recover. By making performance transparent and actionable, the worst performers became some of the best in the company.
That is the quiet power of good dashboarding: it does not flatter strong sites and hide weak ones. It gives every site the same chance to see, own, and fix their reality.
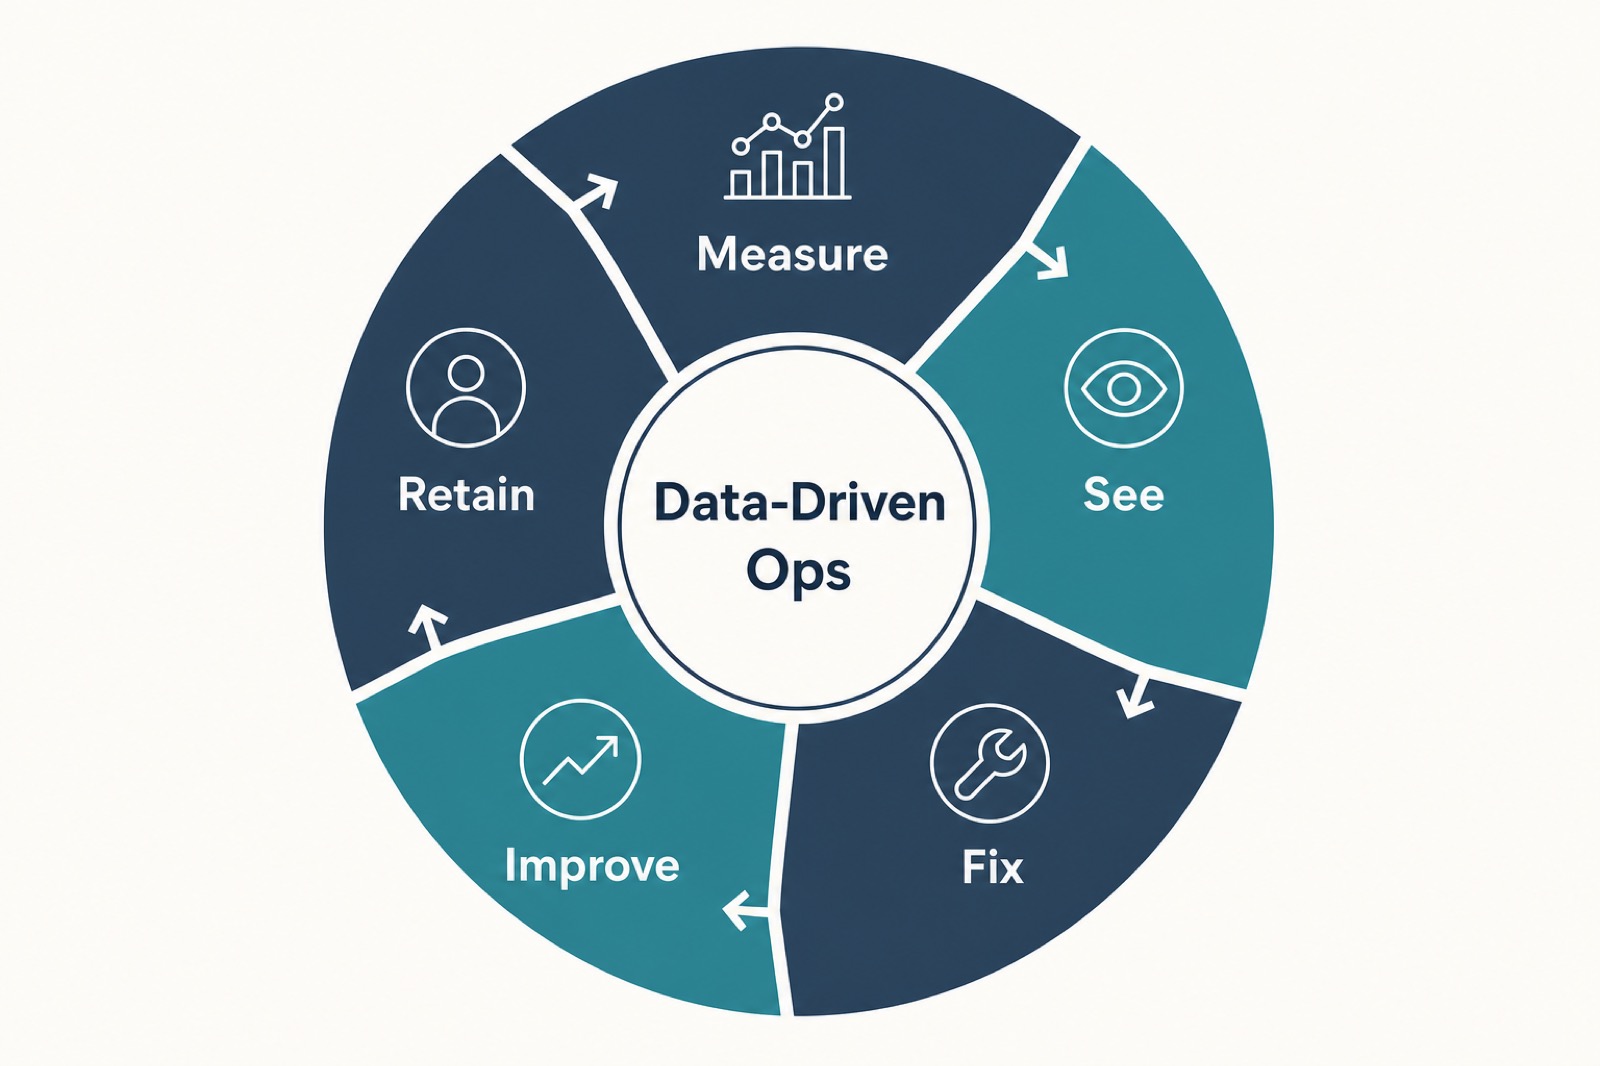
Figure 5 — The turnaround flywheel: measure → see → fix → improve → retain.
How to turn around your business
You do not need a multi-year digital programme to start. You need discipline.
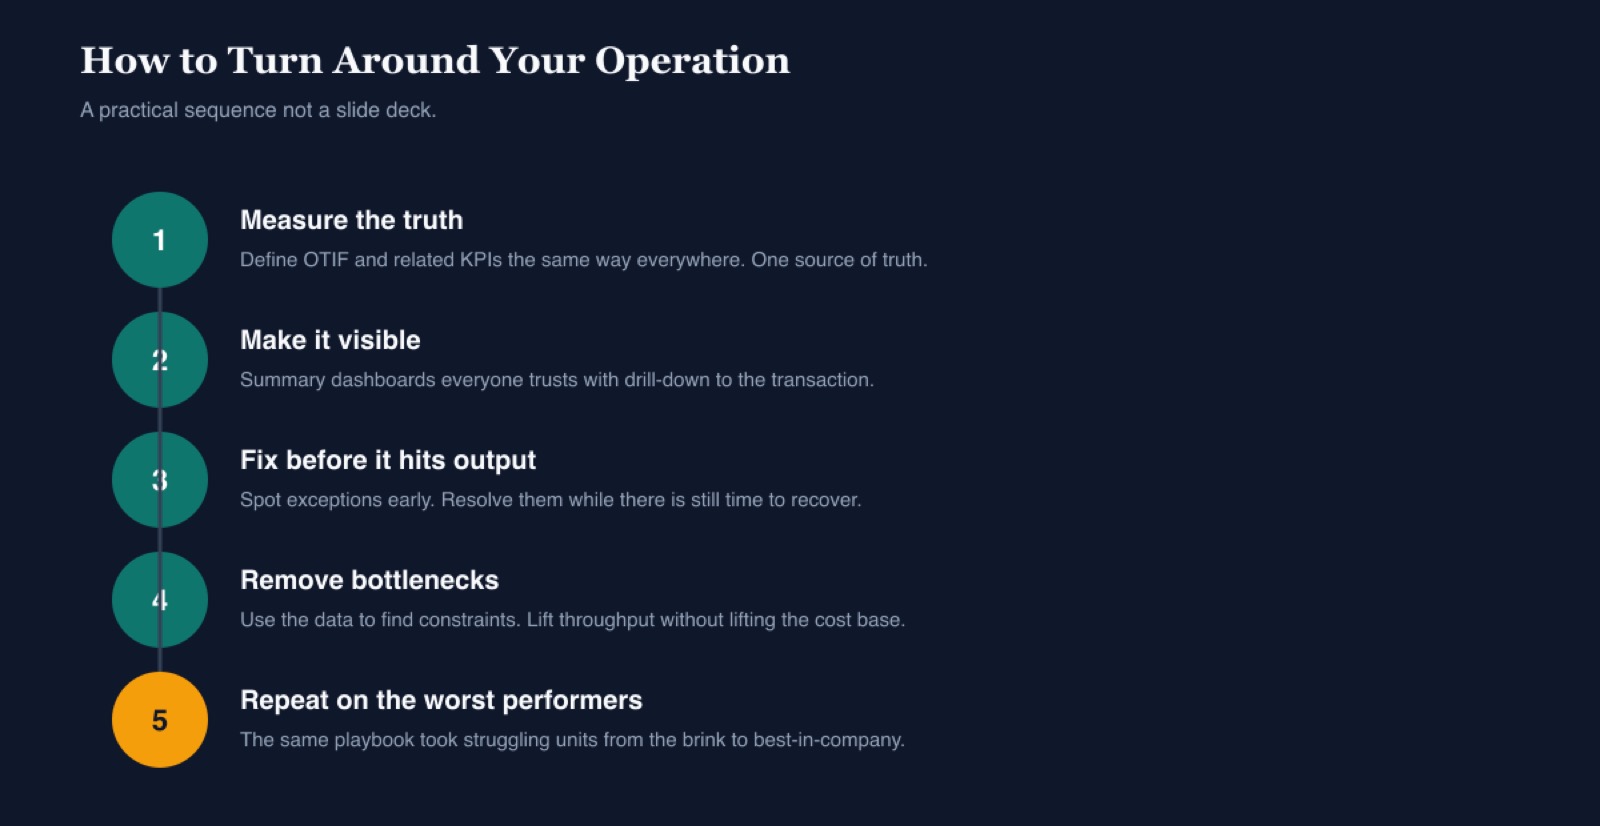
Figure 6 — Five steps. No theatre.
- Define one truth. Agree the definitions for OTIF, lead time, fill rate, scrap, dock-to-stock, and whatever else you claim to manage. If two systems disagree, the dashboard is lying.
- Build the ladder, not a wallpaper. Summary KPIs must open into process views, and process views must open into transactions. If a manager cannot answer “which orders?” in two clicks, the tool is not operational.
- Put the truth on the wall. Large screens in the lobby and operational areas make performance unavoidable — visitors see it, teams see bottlenecks forming, and orders approaching cut-off get moved before trucks leave.
- Manage by exception every day. Surface tomorrow’s failures today — shortage, late ASN, capacity clash, quality hold, transport gap — while recovery is still possible.
- Attack bottlenecks, not symptoms. Find the constraint that caps throughput. Fix that first. Capacity added in the wrong place is just expensive motion.
- Repeat on the worst performers. The method that lifts the average is the method that rescues the outliers.
- Protect the people dividend. Track retention, overtime, and complaint load. A “green” OTIF built on exhausted teams will not hold.
Manufacturing and warehousing are the same problem in different clothes
In a factory, the transaction might be a work order, a changeover, or a scrap event. In a DC, it might be a pick line, a put-away delay, or a carrier cut-off miss. The pattern is identical:
- Aggregate performance tells you that you have a problem.
- Process views tell you where it lives.
- Transactional drill-down tells you what to do before 3pm.
Companies that stop at PowerPoint summaries stay stuck. Companies that connect the summary to the transaction start winning.
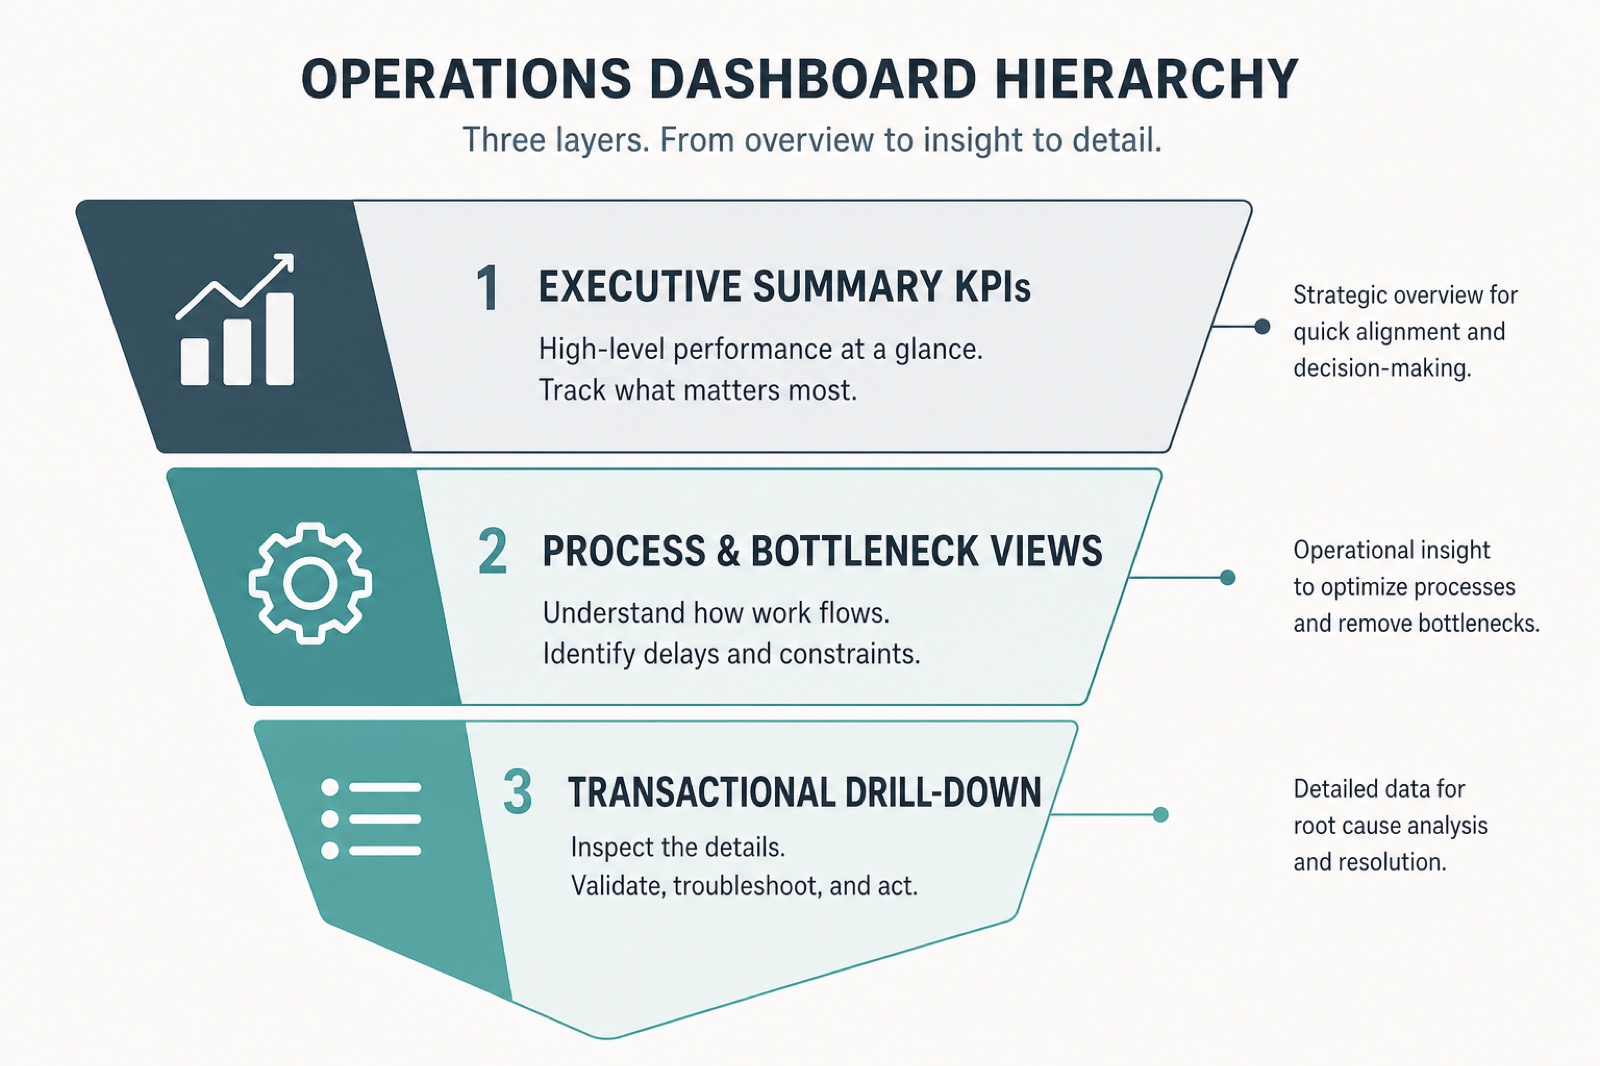
Figure 7 — Hierarchy of control: the further you can drill, the faster you can act.
What twelve months of data discipline buys you
- Lower cost to serve — less rework, less expediting, less firefighting overtime.
- Fewer complaints — commercial teams spent less time apologising and more time growing.
- Higher customer and client satisfaction — service became predictable.
- Better staff retention — people could succeed at their jobs without sacrificing their lives.
- Headroom for real improvement — automation, layout, process redesign — because the basics finally stopped consuming every hour.
When the auditors noticed
Clarity is hard to fake. When BCG came through on an audit and saw these dashboards live, their comment was simple: “We have never seen something so clear and transparent.”
They then asked us to come and teach their experts in Europe how to do the same. We declined. This operating model is proprietary — built from real turnarounds, not a slide pack — and it stays with the operators who implement it.
That reaction is the point. You do not need another layer of expensive advice to explain what your operation already knows. You need visibility that works on the floor, on the wall, and in the numbers — with implementations that have already proved it in the real world. That is what RASGR delivers.
Proven where the work is hardest
This is not a theory built for easy markets. The same approach has been applied successfully across ten countries — including some of the most operationally demanding environments in Asia. Different languages, different systems, different labour markets. Same principle: transparent measurement, transactional accountability, bottleneck focus.
Every one of those deployments succeeded. Not because the cultures were identical, but because the operating logic was.
It does not matter which ERP you run
Dashboard turnarounds are not locked to a single vendor stack. We have delivered this on Priority, IBM iSeries, SAP, and Odoo — and we can work with any ERP. What matters is connecting your system of record to a transparent, drill-down operating view your teams will actually use.
If your operation is stuck, we are just an email away
Turnarounds do not require mystery. They require clear measurement, honest dashboards, and the discipline to act on what the data shows — especially when the numbers are uncomfortable.
If you are fighting OTIF, cost, complaints, or a business unit that feels close to the brink, reach out. We have done this in environments where many programmes fail, and we are happy to talk through what would work in yours.
Email: hamish@rasgr.com
Measure it. Manage it.
Warehouse Automation ROI: A Practical Guide for Asian Operations
Published July 9, 2026 · By RASGR
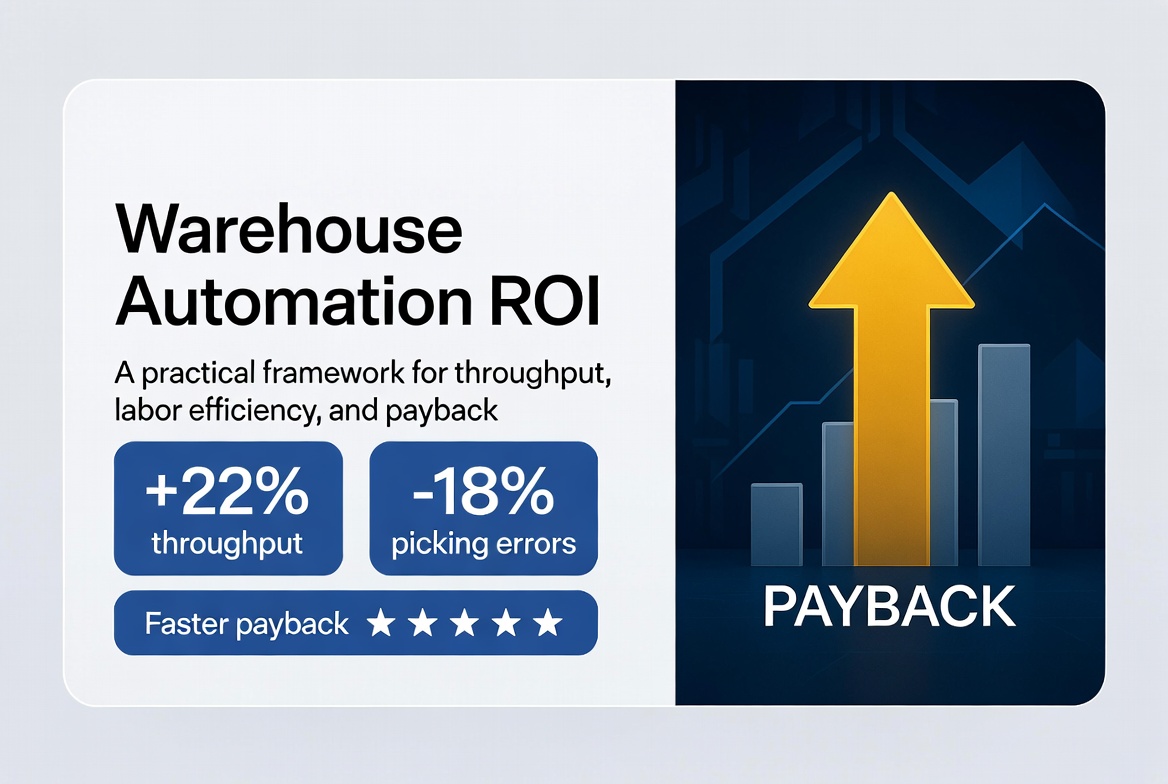
If your warehouse or factory is still heavily dependent on manual labor for material movement, picking, and inventory management, it might be time to evolve. Labor shortages, rising costs, increasing customer expectations, e-commerce volatility, and supply chain disruptions are making traditional approaches unsustainable — especially across Southeast Asia.
The economics have shifted dramatically. What was once considered expensive and risky automation is now one of the smartest strategic investments a medium-to-large operation can make. Companies that implement automation thoughtfully are seeing measurable gains in productivity, accuracy, safety, and long-term competitiveness.
Why Warehouse Automation Now?
Labor costs in Southeast Asia have risen 7 to 12 percent annually since 2020, while the cost of automation technology has dropped 30 to 40 percent. The crossover point has clearly arrived for medium-to-large warehouses and factories in Thailand, Vietnam, Malaysia, and beyond.
Beyond pure cost, businesses today face multiple converging pressures. Chronic skilled labor shortages make it difficult to maintain consistent output. Stricter safety regulations and growing worker expectations increase compliance burdens. E-commerce-driven demand volatility requires faster, more flexible operations. Supply chain disruptions have highlighted the risks of over-reliance on manual processes. At the same time, there is mounting pressure to improve sustainability metrics and reduce carbon footprints. Modern warehouse automation solutions — from AGVs and robotic arms to intelligent storage and AI-driven optimization — address all of these challenges simultaneously, delivering not just efficiency, but true operational resilience.
The Real Numbers
Here are realistic investment and payback figures based on typical RASGR deployments in Asian operations. These numbers reflect real-world projects accounting for local installation, integration, training, and ongoing support costs:
AGV Fleet (5 units): $250K to $400K investment → $80K to $120K annual savings → 2.5 to 4 year break-even.
Conveyor + Sortation Systems: $100K to $200K investment → $40K to $70K annual savings → 2 to 3 years.
RFID Inventory System: $50K to $80K investment → $25K to $40K annual savings → 1.5 to 2 years.
Full AS/RS System: $500K to $1.2M investment → $200K to $350K annual savings → 2.5 to 3.5 years.
These figures can vary based on facility size, existing infrastructure, and level of customisation, but they provide a solid benchmark for planning.
Hidden Savings Most Operators Miss
The true return on investment extends well beyond direct labor cost reduction. Many of the biggest benefits come from improvements that are often overlooked in initial calculations:
- ✓60 to 80 percent fewer picking and sorting errors — dramatically reducing rework, returns, and customer complaints
- ✓Up to 40 percent reduction in workplace injuries — lowering insurance premiums, compensation claims, and lost productivity
- ✓True 24/7 operation capability — without the fatigue, overtime premiums, or shift limitations of manual labor
- ✓Inventory accuracy improving from ~85% to 99.5%+ — reducing stockouts, overstock, carrying costs, and lost sales
- ✓Reduced product damage and lower insurance premiums — plus improved customer satisfaction and brand reputation
Where to Start – A Practical Roadmap
Step 1 — Audit First. Before investing in any technology, conduct a professional process audit. This step alone often uncovers 20 to 30 percent efficiency gains through better workflows, layout optimisation, and data visibility — all before purchasing new equipment. A thorough audit reveals true bottlenecks, data gaps, and opportunities specific to your operation.
Step 2 — Target Low-Hanging Fruit. Focus on high-impact, relatively quick-to-deploy solutions such as AGVs for repetitive long-haul transport or RFID for accurate, automated cycle counting. These deliver fast, visible wins that build internal buy-in and provide early ROI to justify larger investments.
Step 3 — Plan for Full Integration. Sustainable success requires seamless connection between automation hardware, your WMS, ERP, MES, and other existing systems. Poor integration is one of the leading causes of underperforming projects. RASGR specialises in end-to-end integration, ensuring all components work together as one cohesive, scalable operation.
Ready to Calculate Your ROI?
Warehouse automation is no longer a futuristic concept — it is a proven, rapidly payback investment that strengthens your competitiveness, operational resilience, and sustainability across Asia.
Contact RASGR today for a no-obligation site assessment and a personalised ROI projection tailored to your specific facility, product mix, and growth plans.
Email: hamish@rasgr.com Phone: +66 953 198 578